The National Association of Farm Animal Welfare (NAFAW) does a number of projections involving livestock production. This is a gallant try with certain unavoidable exceptions. Although I agree with the difficulty of the data, I do disagree with the final numbers, slightly off, but useful to every business person involved in any of these segments. Perhaps the chart itself is a basis for each producer to make their own chart with different business plans.
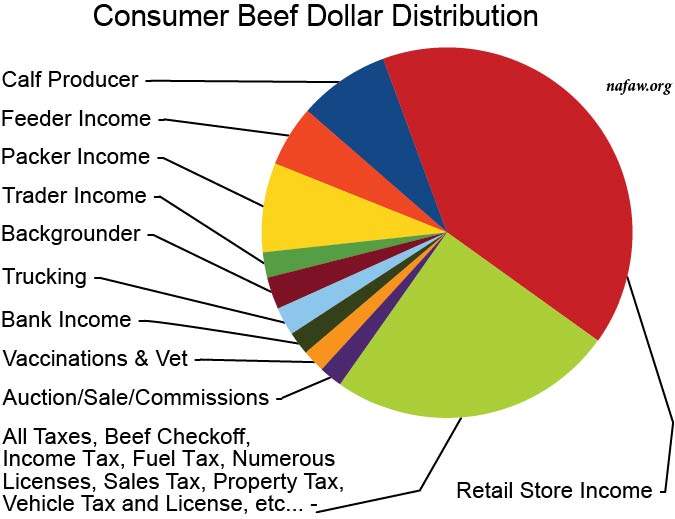
As commercial cattle prices fluctuate up and down, certain parts of the industry go broke and others flourish. The NAFAW chart draws a picture of where the beef dollar goes. The steak purchased by a consumer averages 8 owners from the cow-calf producer to the family table. Young beef steers travel up to 3000 miles in a life span of under 30 months. They are subjected to an average 5 auction experiences and up to 6 full batteries of vaccinations, many are duplicates within days, as ownerships transfer. Many steps are financed by borrowed money. A wide range of service providers earn a small piece of the big pie as steers stampede through a short-fast life.
This is what the cattle business is in total. Who is profiting? Who is taking the risks? Who pays for death loss? Who has no possibility of death loss? Who’s business is booming? Who is struggling to be solvent?
The cattle business is divided in many parts. Registered seed stock production represents less than 5% of the industry and is minimally affected by the end beef dollar. Registered values are based on genetic superiority, data of excellence, a lot of marketing investment, and support of the breed associations documentations. Commercial livestock is mainly where beef at the local stores is produced and most of the registered procedures can be avoided, yet the $100,000 bull will always come from registered stock.
NAFAW attempts to identify which of hundreds of taxes affect each beef producing segment. Taxes are a major cost to the beef industry, but a clear profit to the government. For instance the retailer, according to USDA, gets 56% of the beef dollar, well over half, but also is subject to the largest (non capital gain) tax amounts, which cuts their part of the pie the most. They make the most and pay feds the most. It is easy to believe the packer/processor income is larger than the NAFAW number due to the average 30% increase in processing fees during the last year; however, they also are paying more tax.
A consistent tax is private property. It takes grass to grow cattle and that is a huge tax. Call this a “cow tax.” If grazing land is taxed at $10 per acre and it takes 10 acres to maintain a cow, that is a $100 annual cow tax. This immediately comes off the price of every calf that sells — the feds have no death loss.
Everyone selects their own business model. Some can never be happy unless they are raising the very elite quality stock, working everything to professional standards. Others tie their trucks together with hay strings and work to be economical in every way.
Regardless of all factors, NAFAW provides a valid, but interesting pie chart with lessons for all. Every area and every owner does it different. Erroneous, due to variations, as it obviously is, it may quite well be within 1% of absolutely correct. D


